
Information from your own community will probably be the most useful to you. You can learn how to gather and use data from your own community in Section 4.3 and Section 4.4. But it is also really helpful and can be the best use of your time to use existing national and state data.
Here you will find different data sources that might be useful to you. They are organized by topic and may be updated as new sources become available. Please browse through them now and check back later as it fits your community projects.
Native CARS and Motor Vehicle Injury Data Projects
In this box you will find materials produced by the Native CARS and Motor Vehicle Injury Data Projects.
Video:
Presentations:
- The Native CARS Atlas Presented to Kidz in Motion
- Native CARS a CBPR Success Story presented at Native Research Network
- Reported Motor Vehicle Fatalities on Tribal Lands and Geographically Matched non-Tribal lands in the Pacific NW
- Evaluating the Completeness of FARS for NW Tribes
- Trends in Motor Vehicle Injury Emergency Department Visits
Articles and Reports:
- Improving Data on Child Passenger Safety, IHS Primary Care Provider
- Trends and Correlates of Child Passenger Restraint Use in Six NW Tribes
- Native CARS Aggregate Report 2009
- NPAIHB July Health News & Notes 2019: Pages 10-12
- NPAIHB July Health News & Notes 2021: Pages 10-12
- NPAIHB July Health News & Notes 2022: Pages 14-15
Academic Posters:
- Native CARS Atlas Poster Lifesavers Conference -PDF
- Effectiveness of Tribe Driven Interventions to Improve Child Passenger Safety
- Using Tribal Data to Drive Effective Interventions
- The Nez Perce Tribe’s Media Campaign to Improve Child Safety Seat Use
- Native CARS — A Health Program of the Shoshone Bannock Tribes
- Colville Tribes Increase in Child Safety Seat Use
- Colville Confederated Tribes Child Restraint Law Development
- Motor Vehicle Crash and Fatalities in American Indian Tribal Communities in the NW
- Using Race-Corrected Death Certificate Data
Tutorials on Using National Data Systems to Find AI, AN Injury Data
The Fatality Analysis Reporting System (FARS) a tool from the National Highway Traffic Safety Administration (NHTSA)
Using this tutorial, you will find FARS data on fatal injury crashed in your area and navigate where they occurred geographically. Below is a brief outline for navigation, download our tutorial for more in-depth guidance.
Download the full tutorial here: Using FARS FIRST, a PowerPoint Document
Brief tutorial, visit: https://cdan.dot.gov/query
- Click on “Occupants” tab
- Select years
- Select the State
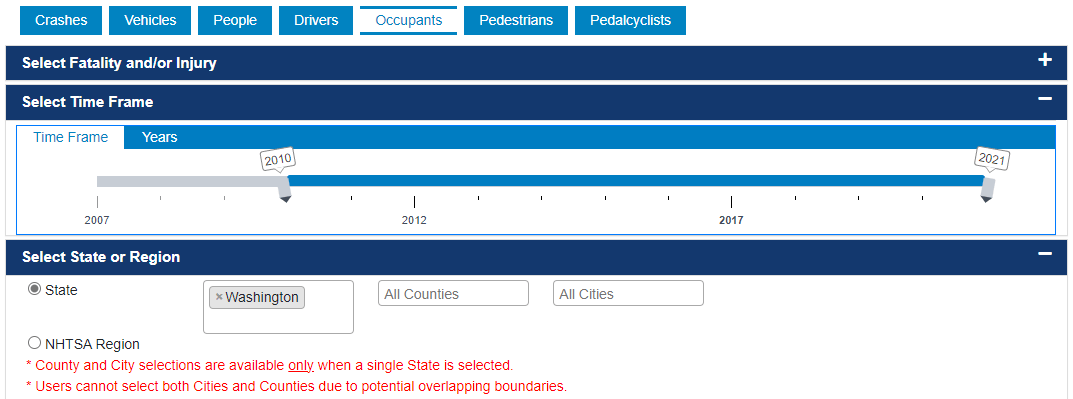
-
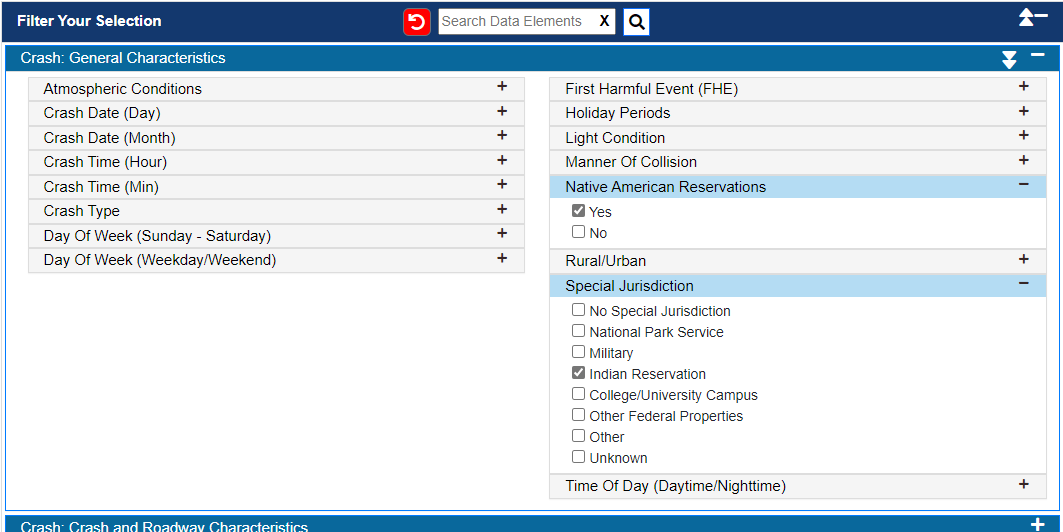
- Crash: General Characteristics
- Native American Reservations-Yes
- Indian Reservation –Check
- Crash: General Characteristics
-
- Person: Person Characteristics
- Injured: Incapacitated -Check
- Unrestrained/Not helmeted- Check
- Build your report –Remove crash date (Month)
- Person: Person Characteristics
- Submit
Download the results (in pdf, excel or rtf formats)
Download the full tutorial to learn how to view & modify the map, or click:
- On “Total” counts
- Zoom in on Washington State
- All the years (2010-2020)
- Bureau of Indian Reservation
- Print your final map
The Web-based Injury Statistics Query and Reporting System (WISQARS) a tool from the CDC:
Using this WISQARS tutorial, you will find injury-related data, which includes fatal and non-fatal motor vehicle related injury and death data. Outlined is a brief overview, download the full tutorial below.
Download the full tutorial here: Using WISQARS, a PowerPoint Document
Brief tutorial, visit: https://www.cdc.gov/injury/wisqars/index.html
- Click on “Fatal Injury and Violence Data”
- Click “Fatal Injury Reports”
- You must agree to the terms of data to use the information
- Change Filters
- Years: 2001 to 2020
- Geography: Oregon
- Select “Unintentional”
- Scroll Mechanism for “Occupant, MV Traffic”
- Select custom age range for <1 to 8
- Select race: American Indian/Alaskan Native
- Report Layout – Group Results by: Race and Mechanism
- Submit; and you will find there were 12 deaths among AI, ANs in Oregon from 2001 to 2020
Download the results for your data needs
The CDC Wide-ranging Online Data for Epidemiologic Research (WONDER):
The CDC WONDER tutorial will teach you how to create your own motor vehicle fatality chart. You will find in-depth guidance by downloading the full tutorial below.
Download the full tutorial here: Using CDC WONDER, a PowerPoint Document
Brief tutorial, visit: https://wonder.cdc.gov/
- Underlying Cause of Death
- 1999-2020:Underlying cause of death by bridged race categories
- Group Results by Year
- Group by Race
- Click “Age Adjusted Rate”
- Select State
- Select Years
- Cause of death: ICD-10 113 Cause List
- MV accidents: this displays unintentional MV traffic and non-traffic deaths
- Send
To alter the chart, click:
- Chart
- Chart options
- Age-adjusted rate
- Line graph
- Vertical
- Change chart
National Child Passenger Safety Seat Data Resources and Reports
NSUBS: National Survey of the Use of Booster Seats
- On NHTSA’s NSUBS page you will find publications going back to 2006 until 2023 about nationwide booster seat use.
NOPUS: National Occupant Protection Use Surveys
- On NHTSA’s NOPUS page you will find publication about national use of occupant protection surveys from 1995 to 2023.
CDC Data and Resources for States and Tribes
- Where fact sheets, prevention strategies, other transportation safety related documents are available for download and use, a handful of which are tribal specific documents.
- Where information about tribal road safety practices and toolkits are found, of which can be adapted to your specific community, along with other useful motor vehicle injury prevention resources available for your use.
- On the Transportation Safety for Tribes’ website you will find many resources to address transportation safety in tribal communities. There are; funding opportunities, training offerings, data resources, and many more useful resources.
The National Digital Check Form’s (NDCF) National Dashboard
- Where you will find nationwide data on car seat checks completed using the National Digital Car Seat Check form. Certified Child Passenger Safety Technicians visiting the website also have the option to register for the NDCF.
State Crash Data
Crash data may be available from your state. Formats vary by state, from summarized reports, to spreadsheets, to interactive sites where you can search for the data you want to see. Your best bet for finding crash data for your state is searching for it online, or contacting your state department of transportation. Here are some resources we have used in the Northwest:
Idaho:
Oregon:
- Oregon Department of Transportation’s (ODOT) Crash Statistics and Reports
- ODOT’s State Highway Crash Reports
Washington:
- Washington State Department of Transportation’s Crash Data; with data available for funding seeking purposes
Hospital Data Reports
July Health News & Notes 2021 PDF:
- Pages 16-17
July Health News & Notes 2022 PDF:
- HN&N 2022 pages 1, 4-5
- HN&N 2022 pages 40-41
National Child Safety Seat Data Resources and Reports

Native CARS Publications

- Effectiveness of Tribe Driven Interventions to Improve Child Passenger Safety
- Using Tribal Data to Drive Effective Interventions
- The Nez Perce Tribe’s Media Campaign to Improve Child Safety Seat Use
- Native CARS — A Health Program of the Shoshone Bannock Tribes
- Colville Tribes Increase in Child Safety Seat Use
- Colville Confederated Tribes Child Restraint Law Development
NPAIHB Motor Vehicle Injury Data Content

Tutorials on Using National Data Systems


State Crash Data

Crash data may be available from your state. Formats vary by state, from summarized reports, to spreadsheets, to interactive sites where you can search for the data you want to see. Your best bet for finding crash data for your state is searching for it online, or contacting your state department of transportation. Here are some resources we have used in the Northwest: